Element focus · Lead

Lead isotopes: a geological fingerprint for sources and provenance.

Lead isotope ratios can distinguish materials that contain the same element but originate from different geological sources. This makes Pb one of the most established isotope systems for tracing contamination, identifying ore provenance and testing links between raw materials, manufactured objects and supply networks.

82 Pb lead 207.2
²⁰⁴Pb non-radiogenic
²⁰⁶Pb radiogenic
²⁰⁷Pb radiogenic
²⁰⁸Pb radiogenic
01 · Context

Why lead?

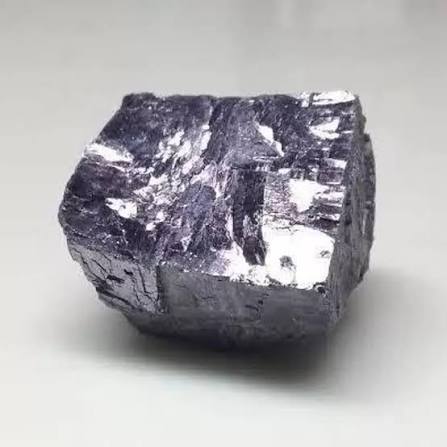
Lead has been mined, transported and transformed for thousands of years. It occurs naturally in mineral deposits, especially galena (PbS), but it is also widespread in mining residues, metallurgical products, urban soils, sediments and industrial materials. Its isotope composition reflects the geological history of the source and can therefore add information that concentration alone cannot provide.

Where is Pb found?

Lead is commonly associated with sulfide mineralisation and polymetallic deposits, particularly galena. Through mining, smelting, metalworking and the historical use of lead-bearing materials, Pb can also accumulate in soils, sediments, dust, industrial residues and manufactured products.

Why is Pb isotopically distinctive?

Lead has four stable isotopes. Three of them — ²⁰⁶Pb, ²⁰⁷Pb and ²⁰⁸Pb — are the end products of radioactive decay systems involving U and Th, whereas ²⁰⁴Pb is non-radiogenic. As a result, ore bodies formed in different geological settings can develop distinct Pb isotope ratios.

Why are Pb isotopes useful?

Pb isotope ratios can be compared between an unknown sample and potential source materials. When suitable reference data exist, they can help exclude incompatible sources, identify plausible origins and reveal changes in raw-material supply, contamination history or metal circulation.

02 · Analytical

How we analyse Pb isotopes.

The analytical workflow isolates Pb from the sample matrix and measures several isotope ratios by multi-collector ICP-MS. Purification is performed by ion-exchange chromatography in an HBr medium, followed by high-precision measurement with instrumental mass-bias correction and reference-standard control.

1

Sample preparation

The preparation is adapted to the matrix. Published workflows used approximately 30 mg of archaeological copper-base material or around 50 mg of ores, artifacts and geological samples before acid digestion.

2

Pb purification

Dissolved samples are converted to an HBr medium and Pb is separated from the matrix on AG1-X8 ion-exchange resin. Matrix elements are washed away before the purified Pb fraction is recovered with HCl.

3

MC-ICP-MS measurement

The purified solution is analysed by multi-collector ICP-MS. ²⁰⁴Pb, ²⁰⁶Pb, ²⁰⁷Pb and ²⁰⁸Pb are measured and combined into diagnostic isotope ratios.

4

Mass-bias correction and QA/QC

Tl addition, sample-standard bracketing and repeated analysis of the NIST 981 Pb isotope standard are used to correct instrumental mass bias and monitor analytical reproducibility.

Lead
Prepare Digest the sample

Acid digestion selected according to matrix and Pb content.

Purify AG1-X8 resin in HBr

Selective separation of Pb from the surrounding matrix.

Measure MC-ICP-MS

Simultaneous acquisition of multiple Pb isotope ratios.

Validate NIST 981 + Tl correction

Standard control, bracketing and uncertainty assessment.

4

Pb isotopes measured

²⁰⁴Pb, ²⁰⁶Pb, ²⁰⁷Pb and ²⁰⁸Pb form the basis of the isotope-ratio system.

30–50 mg

Typical published aliquots

Approximate sample masses used in the Weeks and Heredia analytical workflows. The required amount depends on matrix and Pb concentration.

~95%

Pb recovery

Lead yield reported in the Heredia et al. workflow after sample preparation and purification.

<10 pg

Procedural blank

Total procedural Pb blank reported for the Heredia et al. purification procedure.

50 ppm

External reproducibility

Approximately 0.005% for ²⁰⁷Pb/²⁰⁶Pb, ²⁰⁸Pb/²⁰⁶Pb and ²⁰⁷Pb/²⁰⁸Pb in the Heredia et al. dataset.

100–200 ppm

²⁰⁴Pb-based reproducibility

Approximately 0.01–0.02% for isotope ratios using ²⁰⁴Pb.

50 µL/min

Sample introduction

Micro-concentric nebulizer flow used in the Weeks et al. MC-ICP-MS workflow with a desolvating unit.

0.03–2.44%

Example Pb concentration range

Bulk Pb concentrations quantified by ICP-AES in several al-Midamman copper-base artefacts. This is an application range, not a detection limit.

Method basis

Analytical parameters are based on Heredia et al. (2025) and Weeks et al. (2009). Both studies used AG1-X8 ion-exchange purification and MC-ICP-MS for Pb isotope analysis. The exact digestion, sample amount and analytical route are adapted to the sample matrix and available Pb mass. Neither paper defines a universal concentration detection limit for Pb isotope measurement.   Heredia et al. →    Weeks et al. →

03 · Interpretation

What can Pb isotopes tell us?

Pb isotope interpretation is fundamentally comparative. The measured ratios are evaluated against candidate sources, reference ores, environmental backgrounds or databases. The strongest conclusions come from combining isotope data with chemistry, geological context and independent information on the history of the material.

Test the provenance of metals and raw materials

Lead isotope signatures can be compared with ore deposits or reference materials to determine which geological sources are compatible with a product and which can be excluded.

Example: Roman Pb artifacts manufactured in Vienne showed a tightly clustered isotope composition. Most were most consistent with imported Pb from the Rhenish Massif, with the Pennines also remaining a plausible source.

Distinguish natural background from historical pollution

Changes in Pb concentration can be paired with isotope ratios to determine whether elevated Pb reflects local geology or an anthropogenic input and whether that signal persists through time.

Example: Swedish lake sediments show how Pb isotopes can distinguish natural geological lead from pollution and reconstruct the evolution of anthropogenic contamination through time.

Reconstruct supply and exchange networks

Once a plausible source is identified, isotope evidence can be combined with archaeological, industrial or logistical information to reconstruct how raw materials moved through a supply system.

Example: the Vienne study combined isotope provenance with Roman transport geography to evaluate routes linking mining districts to manufacturing centres through the Rhine, Saône and Rhône networks.

Identify source changes, mixing and material histories

Isotopic clusters can reveal whether groups of objects share a common source, whereas divergent signatures can indicate different supply episodes, different ore sources or mixing between materials.

Example: London air records show how Pb isotopes can reveal changes in pollution sources and identify the continued remobilization of legacy lead long after its original release.
A Pb isotope signature narrows provenance — it does not identify a source by itself.

Geological regions can overlap isotopically, recycling and alloying can mix signatures, and alteration can matter when Pb concentrations are very low. Robust interpretation therefore combines isotope ratios with source databases, elemental chemistry and independent contextual information.

Discuss a Pb project